Introduction: Studies using plunge electrodes (in animals and patients) and plunge optrodes (animals only) to explore transmural electrophysiology (EP) suggest that re-entrant arrhythmias can involve transmural circuits in ventricles. [1] However, the current gold standard techniques (catheter-based electro-anatomical mapping and optical mapping) primarily provide information about near cardiac surface EP. There is, thus, a need for a tissue-non-destructive, transmurally-resolved approach for measuring EP in native hearts. Optoacoustic (OA) tomography shows great promise for addressing this challenge by combining optical stimulation and acoustic imaging modalities. [2] The aim of this study is to measure transmembrane voltage ex vivo across different model systems, and to enhance data quality by developing a customized image processing pipeline. As a first step, we identified reporter agents such as the voltage-sensitive dye BeRST1 (and the genetically-encoded voltage indicators Archon1 and QuasAr3; not used in the results below) that allow OA assessment of transmembrane voltage, opening the possibility for time-resolved, intramural imaging of cardiac EP. Resulting signals exhibit a low signal-to-noise ratio (SNR), which restricts detailed functional analysis of data. To address this, we developed a deep-learning-based image processing pipeline to extract EP information from time-resolved 3D OA images.
Methods: Data was acquired from engineered HEK cells and Langendorff-perfused hearts using a multispectral OA tomography system (iThera Medical). The transmembrane voltage of cells was controlled optogenetically, using expression of a light-activated ion channel (CheRiff, for depolarisation) and a voltage-sensitive potassium channel (Kir2.1, for repolarisation) creating an expected amplitude of ~40 mV to generate 1.0 Hz-cycles of membrane voltage, confirmed utilizing BeRST1. Langendorff-perfused mouse and rabbit hearts were loaded with BeRST1, electromechanically uncoupled (using 2,3-butadione monoxomine) and OA-imaged during electrical pacing at 2.5 Hz. Ultimately, data quality was enhanced with the customized image processing pipeline based on SimpleITK and DeepCAD algorithm. [3]
Results: In this study, we were able to identify the presence and the timing of depolarization events in cell models and whole hearts. Post-processing of OA voltage data allowed an up to 4-fold improvement of SNR in cells, and a 3.5-fold improvement of SNR in hearts revealing transmembrane voltage changes (Figure 1).
Outlook: In future work, acquisition and processing of transmembrane voltage data will be extended to more complex (e.g. arrhythmic) patterns in cardiac tissue to assess whether it is possible to not only improve temporal, but also spatial resolution. Once validated, our approach will be applied to assessing transmural EP properties in whole hearts during normal and disturbed heart rhythms.
References
[1] Pogwizd SM, Corr PB Circulation Research 1990/66:672-695
[2] Ntziachristos V, Razansky D Chemical Reviews 2010/110:2783-2794
[3] Li X et al. Nature Biotechnology 2023/41:282-292
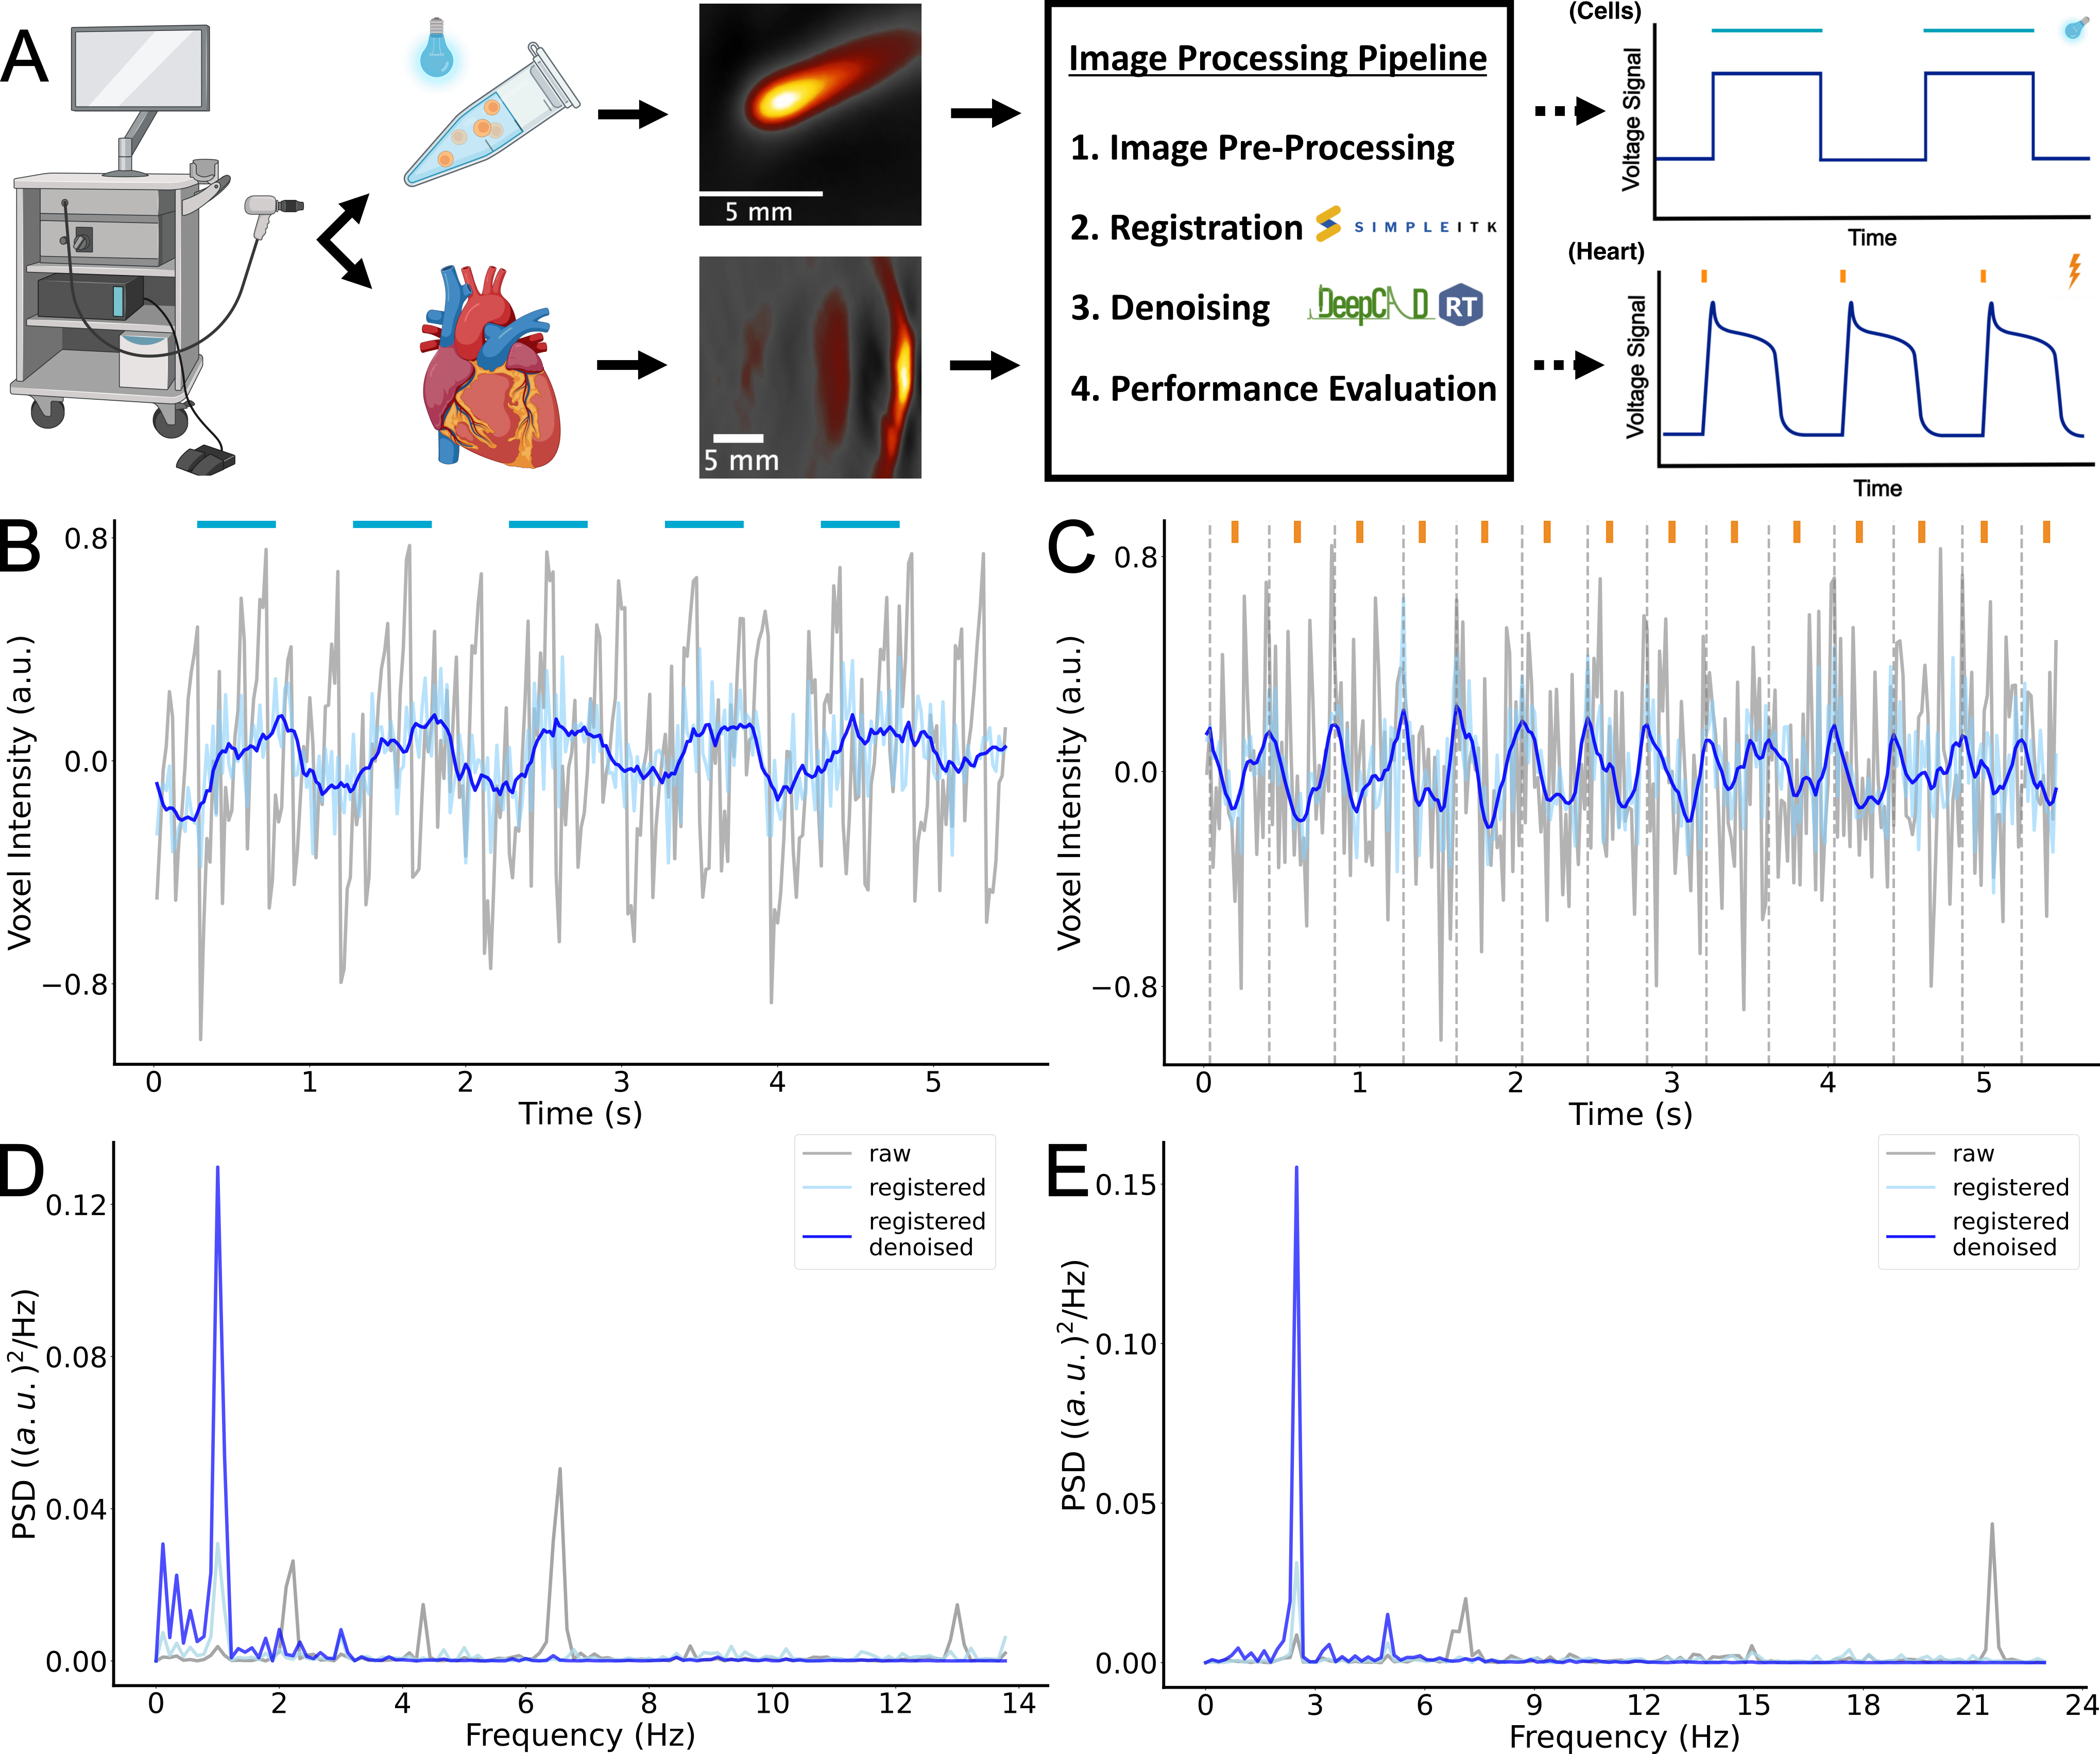
Figure 1: Visualization of the OA workflow and the developed image processing pipeline (A). Voxel intensity plots of raw, registered and registered/denoised OA data from 1.0 Hz optically paced (blue bars) cells (B) and 2.5 Hz electrically paced (orange bars) heart (C) with the corresponding power spectral density (PSD) plots D-E. Dotted lines indicate depolarization peaks.


