Electroanatomical mapping (EAM) is the current standard for characterizing atrial substrate in patients undergoing ablation for atrial fibrillation (AF). While EAM provides detailed spatial information on conduction patterns and electrogram voltage, it does not directly quantify tissue refractoriness, a key property that influences reentry initiation and perpetuation. We thus aimed to measure the effective refractory period (ERP) from intracardiac atrial recordings, including intra-patient heterogeneity.
30 AF patients (14 at the time of submission) undergoing redo ablation after previous pulmonary vein isolation (PVI) were enrolled in this study (64% male, age 69±5.8 years, 64% persistent AF, CHA2DS2-VASc 2.6±1.2). All patients were checked for durable PV isolation, and complete left atrial maps were recorded in a sensed paced mode (500ms basic cycle length).
After electroanatomical mapping, five to ten locations were chosen to measure the ERP, aiming to cover different anatomical regions and electrogram characteristics. ERP was determined by incremental S1S2 stimulation and defined as the last non-capturing S2 period. Locations were categorized using the automatic atrial annotation system DIVAID [1] to investigate spatial differences between eight different left atrial regions.
Persistent AF patients showed a lower mean ERP (234.4±28.9ms) compared to paroxysmal AF patients (259.7±17.4ms). Intra-individual ERP variance was low, with a median of ERP range (highest to lowest) per patient of 35ms. However, a few patients with high ERP ranges of up to 150ms.
For each ERP recording, the corresponding atrial region was annotated, and the relative difference to the mean ERP per patient was calculated (discrepancy = |(ERP-ERP
mean)| / ERP
mean). This metric highlights locations that have a high variability compared to other ERP recordings in the specific patient, i.e., highlighting remodeled tissue. Especially the posterior wall (discrepancy 6%±8%, maximum 34%) showed a deviating ERP within individual patients. In contrast, the inferior wall showed a lower discrepancy (4%±2%).
In this study, we investigated ERP distribution in the left atrium. We showed that ERP discrepancy varies between atrial regions, showing that the posterior wall has a high variance in our ERP measurements. Extending this analysis can help electrophysiologists focus ERP measurements on highly diverse regions within procedures and inform the personalization of digital twin computer models.
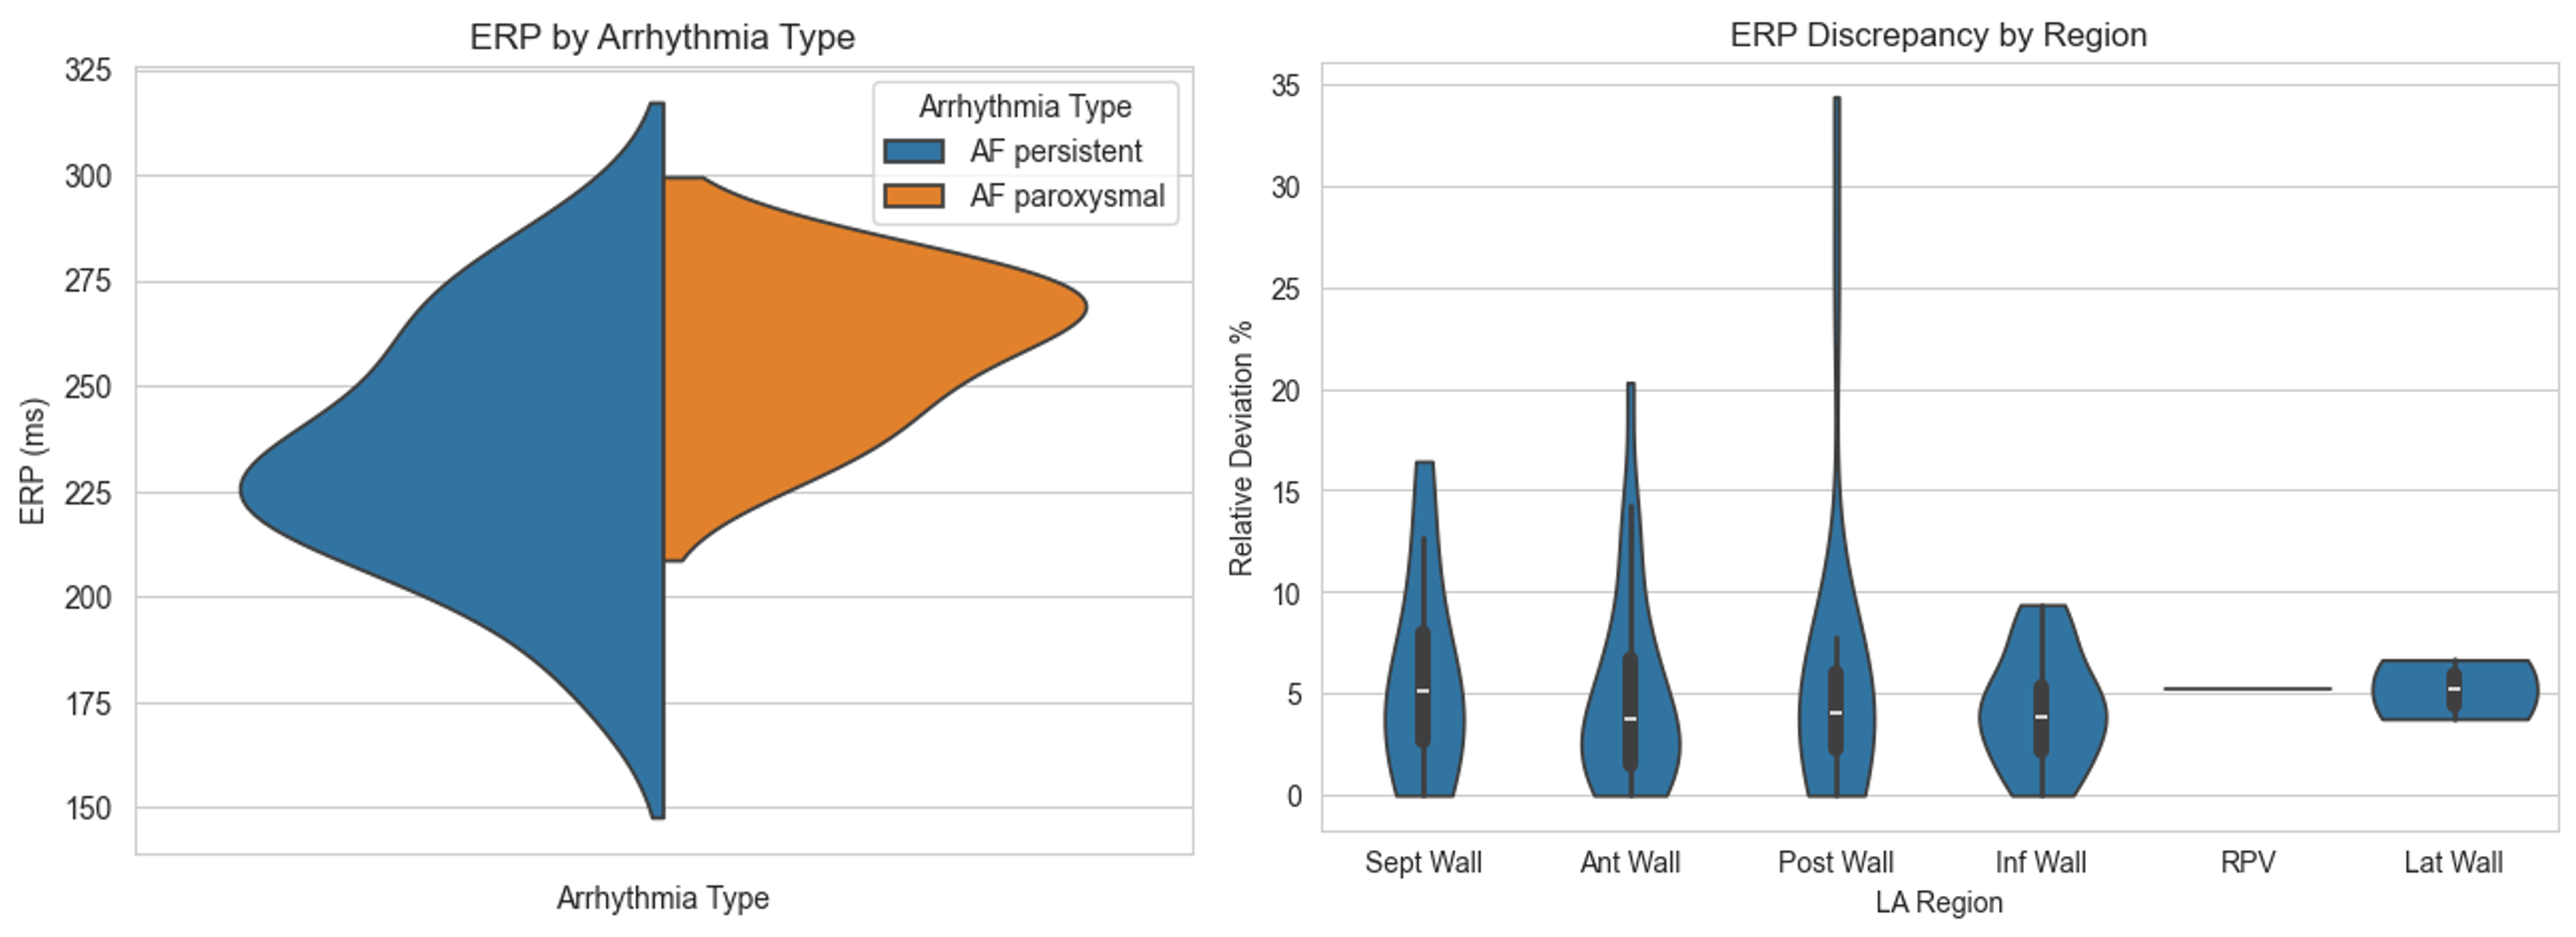
Mean per patient ERP splitted by arrhythmia type (left). ERP discrepancy (|(ERP-ERP
mean)| / ERP
mean) grouped by LA region (right).
[1] T. Althoff, R.H. Anderson, C. Goetz et al., "Regionalization of the atria for 3D electroanatomical mapping, cardiac imaging, and computational modelling: a clinical consensus statement of the European Heart Rhythm Association and the European Association of Cardiovascular Imaging of the ESC," EP Europace, vol. 27, p. euaf134, 2025. doi:10.1093/europace/euaf134


