Aims/hypothesis: To assess the potential for precision medicine in diabetes mellitus by evaluating the presence and degree of dose-dependent variability of treatment responses regarding HbA1c. If such potential was present, an increase in drug dose would be associated with higher response heterogeneity, and thus with consequent promise for a precision approach.
Methods: Using data from 44 randomized clinical trials with 44 placebo and 101 verum (i.e., active treatment) arms including 23,395 participants, we performed a meta-regression analysis to determine dose-dependent variability of HbA1c (as determined by the natural logarithm of the standard deviation, i.e. Log[SD]) in response to glucose-lowering drug treatments in each trial arm. The percentage dose (ranging from 0 to 100%; placebo arms and verum arms with maximal dose, respectively) as well as the Log(Mean) of HbA1c were considered as fixed effect covariates.
Results: Our analyses identified variability of HbA1c values after treatment with a median Log(SD) value of 0.11% in the placebo arms, as compared to 0.02% in the verum arms. The primary weighted meta-regression model showed a regression coefficient of 0.025 (95% CI: -0.050 to 0.099) pointing to a very slight increase of Log(SD) of HbA1c values with higher percentage doses.
Conclusions/interpretation: Considering the current glucose-lowering treatment options, our results found no significant dose-dependent variability of HbA1c, with consequent limited potential for precision medicine in the treatment of type 2 diabetes.
Table 1 Description of included trial arms separated by placebo and verum arms
|
|
|
Placebo (N=44 arms)
|
|
Verum (N=101 arms)
|
|
Variable
|
|
Number of missing arms
|
Median
(Min/Q1/Q3/Max)
|
|
Number of missing arms
|
Median
(Min/Q1/Q3/Max) or
Number (%)
|
|
Mean age at baseline (in years)
|
|
1
|
55.6
(52.0/54.3/58.6/63.2)
|
|
4
|
56.0
(50.6/54.6/58.5/63.2)
|
|
Proportion of male participants at baseline (in %)
|
|
1
|
54.0
(0.5/50.0/58.9/76.7)
|
|
4
|
55.9
(0.4/49.1/60.2/76.9)
|
|
Mean BMI at baseline (in kg/m2)
|
|
1
|
31.0
(24.9/28.7/32.7/34.7)
|
|
4
|
31.1
(24.4/29.2/32.3/35.0)
|
|
Mean known disease duration at baseline (in years)
|
|
10
|
6.6
(1.1/4.6/9.4/14.8)
|
|
22
|
6.6
(1.0/4.3/9.3/16.2)
|
|
Mean HbA1c at baseline (in %)
|
|
0
|
8.2
(7.1/8.0/8.7/10.4)
|
|
0
|
8.1
(7.1/8.0/8.7/10.3)
|
|
Year
|
|
0
|
2013.5
(1998/2007/2016.5/2019)
|
|
0
|
2013
(1998/2006/2017/2019)
|
|
Duration of treatment (in weeks)
|
|
0
|
26
(16/24/28/206)
|
|
0
|
26
(16/24/26/206)
|
|
Treatment (drug class)
|
|
|
|
|
|
|
|
Alpha-glucosidase inhibitors
|
|
--
|
--
|
|
0
|
4 (4)
|
|
DPP-4 inhibitors
|
|
--
|
--
|
|
0
|
10 (10)
|
|
GLP-1 receptor agonists
|
|
--
|
--
|
|
0
|
29 (29)
|
|
Metformin
|
|
--
|
--
|
|
0
|
6 (6)
|
|
SGLT-2 inhibitors
|
|
--
|
--
|
|
0
|
30 (30)
|
|
Thiazolidinediones
|
|
--
|
--
|
|
0
|
22 (22)
|
|
Number of treated individuals
|
|
0
|
110.5
(11/70/139/2266)
|
|
0
|
123
(11/80/163/2279)
|
|
Log(SD) of HbA1c values after treatment (in %)
|
|
0
|
0.11
(-0.98/-0.12/0.35/1.03)
|
|
0
|
0.02
(-0.82/-0.22/0.24/0.99)
|
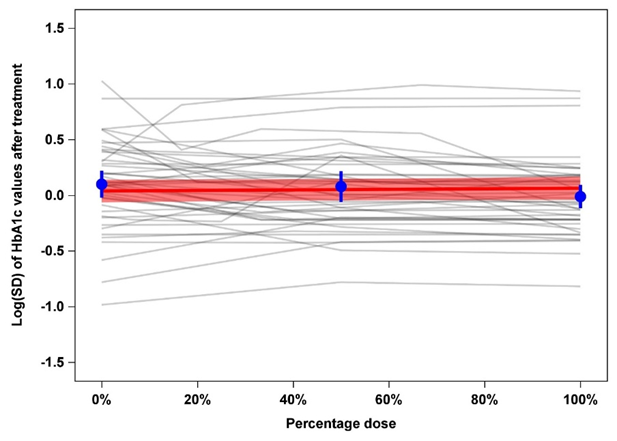
Figure 1: Line plot for the trajectories of raw Log(SD) values of HbA1c against percentage dose (0% = placebo arm, 100% = verum arm with maximal dose). Each grey line stands for the Log(SD) trajectory of a single trial. The red line gives the fitted line from the primary weighted meta-regression model with its 95% confidence interval. Estimates (with 95% confidence intervals) for the observed (unadjusted and unweighted) mean Log(SD) values at 0%, 50%, 100% dose are given in blue.